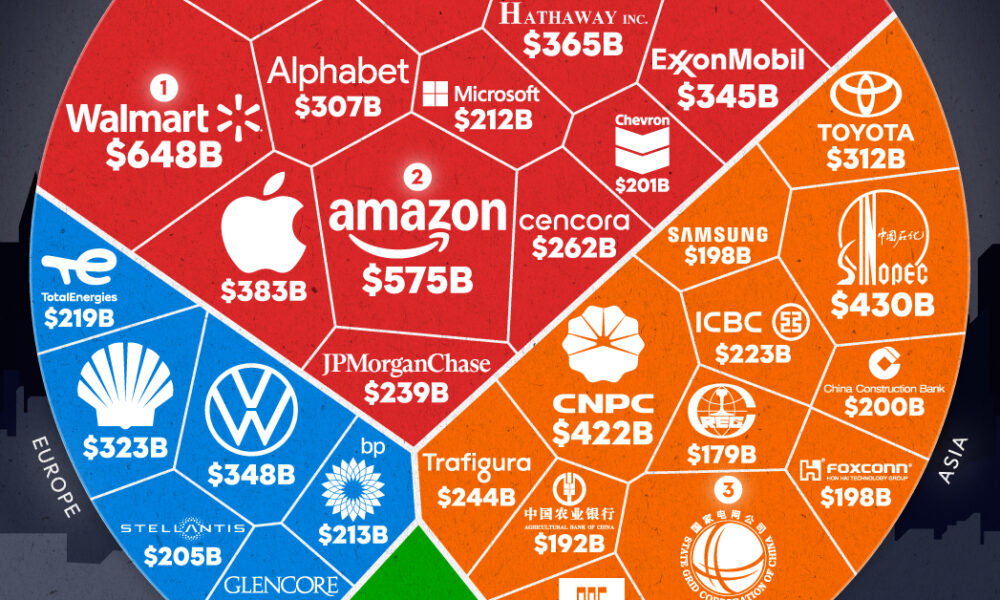
The World's Top Companies by Revenue in 2024
See this visualization first on the Voronoi app.
The World’s Top Companies by Revenue in 2024
This was originally posted on our Voronoi app. Download the app for free on iOS or Android and discover incredible data-driven charts from a variety of trusted sources.
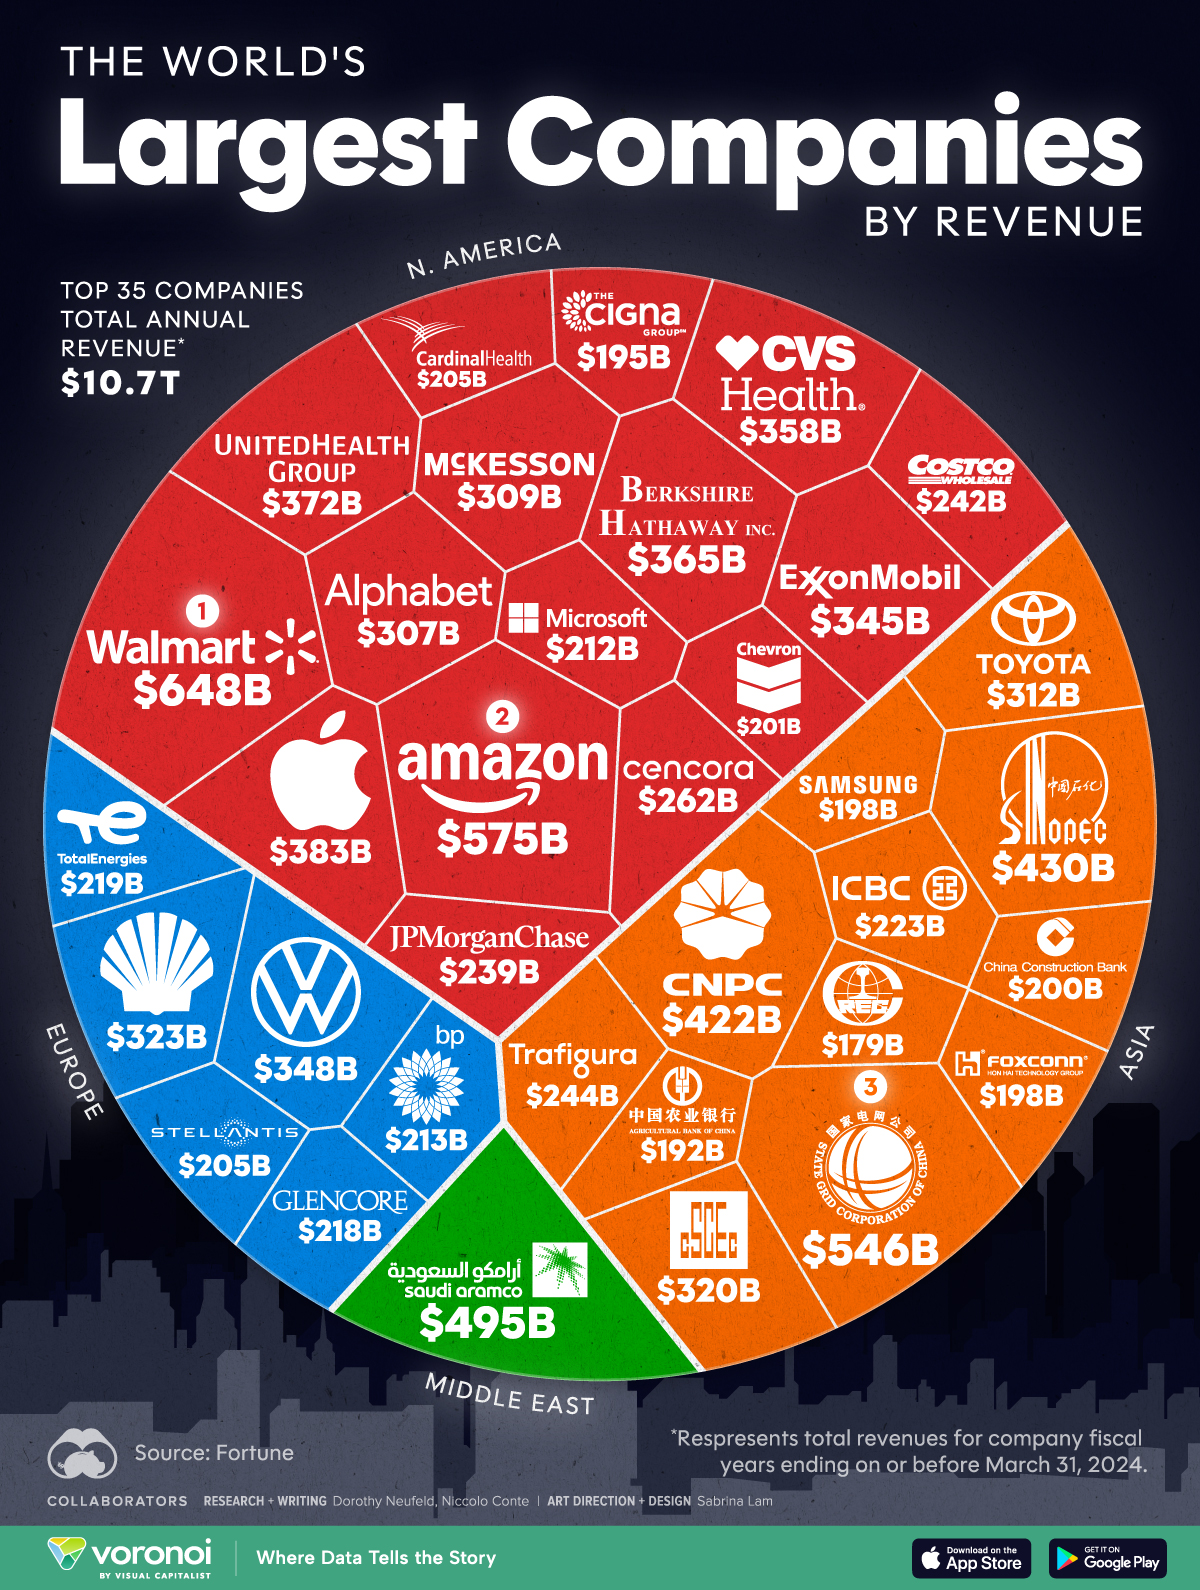
Today, U.S. retail giants are the largest companies by revenue globally thanks to their international reach and the strength of the American consumer.
Looking beyond the U.S., many of the world’s leading companies by this measure are in the energy sector. Notable heavyweights, such as Saudi Aramco and China National Petroleum, are predominantly state-owned with expansive global operations.
This graphic shows the top companies by revenue worldwide, based on data from Fortune.
Ranked: The Top 35 Companies with the Highest Revenues
Here are the world’s leading companies by annual revenues in 2024, including both public and private companies that report financial data:
| Rank | Company | Revenues (B) | Country |
|---|---|---|---|
| 1 | Walmart | $648.1 | 🇺🇸 U.S. |
| 2 | Amazon | $574.8 | 🇺🇸 U.S. |
| 3 | State Grid | $545.9 | 🇨🇳 China |
| 4 | Saudi Aramco | $494.9 | 🇸🇦 Saudi Arabia |
| 5 | Sinopec Group | $429.7 | 🇨🇳 China |
| 6 | China National Petroleum | $421.7 | 🇨🇳 China |
| 7 | Apple | $383.3 | 🇺🇸 U.S. |
| 8 | UnitedHealth Group | $371.6 | 🇺🇸 U.S. |
| 9 | Berkshire Hathaway | $364.5 | 🇺🇸 U.S. |
| 10 | CVS Health | $357.8 | 🇺🇸 U.S. |
| 11 | Volkswagen | $348.4 | 🇩🇪 Germany |
| 12 | Exxon Mobil | $344.6 | 🇺🇸 U.S. |
| 13 | Shell | $323.2 | 🇬🇧 UK |
| 14 | China State Construction Engineering | $320.4 | 🇨🇳 China |
| 15 | Toyota Motor | $312.0 | 🇯🇵 Japan |
| 16 | McKesson | $309.0 | 🇺🇸 U.S. |
| 17 | Alphabet | $307.4 | 🇺🇸 U.S. |
| 18 | Cencora | $262.2 | 🇺🇸 U.S. |
| 19 | Trafigura Group | $244.3 | 🇸🇬 Singapore |
| 20 | Costco Wholesale | $242.3 | 🇺🇸 U.S. |
| 21 | JPMorgan Chase | $239.4 | 🇺🇸 U.S. |
| 22 | Industrial & Commercial Bank of China | $222.5 | 🇨🇳 China |
| 23 | TotalEnergies | $218.9 | 🇫🇷 France |
| 24 | Glencore | $217.8 | 🇨🇭 Switzerland |
| 25 | BP | $213.0 | 🇬🇧 UK |
| 26 | Microsoft | $211.9 | 🇺🇸 U.S. |
| 27 | Cardinal Health | $205.0 | 🇺🇸 U.S. |
| 28 | Stellantis | $204.9 | 🇳🇱 Netherlands |
| 29 | Chevron | $200.9 | 🇺🇸 U.S. |
| 30 | China Construction Bank | $199.8 | 🇨🇳 China |
| 31 | Samsung Electronics | $198.3 | 🇰🇷 South Korea |
| 32 | Hon Hai Precision Industry | $197.9 | 🇹🇼 Taiwan |
| 33 | Cigna | $195.3 | 🇺🇸 U.S. |
| 34 | Agricultural Bank of China | $192.4 | 🇨🇳 China |
| 35 | China Railway Engineering Group | $178.6 | 🇨🇳 China |
Figures represent total revenues in companies’ fiscal years ending on or before March 31, 2024.
Ranking in first overall is Walmart, the largest retailer and private employer in America.
Every hour, Walmart generates nearly $74 million in revenue with an average of 255 million weekly store visits across its global customer base. The U.S. makes up 68% of total sales, with domestic revenues rising 36% since 2019.
Amazon follows next in line, with $574.8 billion in revenues. Over the past five years, Amazon’s revenues have more than doubled, driven by cloud computing services, Amazon Prime, and advertising revenues. In 2025, Amazon plans to sell vehicles on its online marketplace in the U.S., further broadening its scope of products.
In third place is State Grid, China’s massive state-owned utilities firm. Last year, the firm purchased two of Chile’s biggest electricity distributors and controls more than 50% of energy distribution across the country. Moreover, State Grid stands as the world’s largest copper buyer, given the metal’s vital role in power grid infrastructure.
Like State Grid, state-owned Sinopec and China National Petroleum rank among the top companies by revenue driven by their significant oil production. In 2023, Chinese oil firms imported a record volume of discounted Russian crude oil, making it the country’s top supplier last year. Today, Sinopec is the largest oil refiner by capacity globally, at 5.2 million barrels per day, exceeding Exxon Mobil, at 4.5 million barrels daily.
Learn More on the Voronoi App 
To learn more about this topic from a tech perspective, check out this graphic on the market cap of the largest 20 tech companies worldwide.

